Blazestack Fire Investigation Case Management Software. Schedule a free demo.

Fire Incidents in Ohio (OH)

US Map


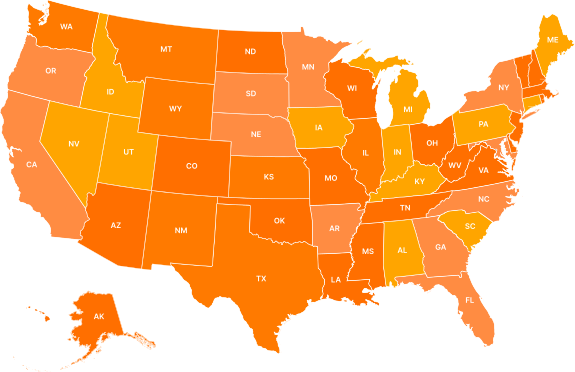
This section offers an overview of all fire incidents in Ohio (OH). We analyzed the annual National Fire Incident Reporting System (NFIRS) Public Data Release files provided by the U.S. Fire Administration's (USFA) National Fire Data Center (NFDC) to get this data. Please note, this isn't a fire census. The input from the fire departments may contain human error but the proportion of fire incidents reported to NFIRS is large enough to make reasonable interferences.

Faster fire reports?

Get a two week free trial and
price quote just for your organization.

Get free trial

Trusted by Public & Private Fire Investigator Teams

Noncontained Fire Incidents in Ohio (OH)

Noncontained fires demand detailed fire investigations so we've only accounted for those in this report. We haven't considered contained fires with no casualties or significant property loss for this section.

Ohio (OH) Fire Incidents (Top 10 Cities)

This table ranks Ohio (OH) cities based on the number of fire incidents. Columbus ranks first with 1393 incidents, while Vandalia ranked last, with 10 incidents.

PositionCity4Y Trend2023202220212020
1Columbus▼1393103710591223
2Cleveland▲109794011231108
3Cincinnati▼932606952977
4Dayton▲704694622695
5Toledo▲698610702685
6Akron▲443566445391
7Canton▼292159197239
8Springfield▲276268228192
9Youngstown▼267259260323
10Hamilton▲2001333160

Ohio (OH) Wildland Fire Incidents (Top 10 Cities)

This table ranks Ohio (OH) cities based on the number of wildland fires. Cleveland ranks first with 195 incidents, while Wooster ranked last, with Loading incidents.

PositionCity4Y Trend2023202220212020
1Cleveland▲195171450
2Canton▲257193
3Milford▲251535
4Chillicothe▲181964
5Dayton↔18122
6Lancaster▲1815185
7Marysville▲1725194
8Anderson Township▲161311
9Youngstown▲161081
10Mount Vernon▲151350

Ohio (OH) Arson Fire Incidents (Top 10 Cities)

This table ranks Ohio (OH) cities based on the number of intentional fires. Cincinnati ranks first with 5 incidents, while Zanesville ranked last, with Loading incidents.

PositionCity4Y Trend2023202220212020
1Cincinnati▲5110
2Cleveland▼4125
3Akron▼3132519
4#N/A▲31284
5Trotwood▲3264
6Columbus↔2112
7Springfield▼2234
8Bellefontaine▲1000
9Boardman Township▲1000
10Brook Park▲1000

Ohio (OH) Juvenile Arson Fire Incidents (Top 10 Cities)

This table ranks Ohio (OH) cities based on the number of juvenile intentional fires. Delaware ranks first with 1 incidents, while Zanesville ranked last, with Loading incidents.

PositionCity4Y Trend2023202220212020
1Delaware▲1000
2University Heights▲1000
3Akron▼0001
4Alliance↔0100
5Amelia↔0000
6Amherst↔0000
7Anderson Township↔0000
8Ashland↔0000
9Ashtabula↔0000
10Ashtabula Township↔0000

Ohio (OH) Fire Incidents with Civilian Casualties (Top 10 Cities)

This table ranks Ohio (OH) cities based on the number of fires with civilian casualties. Columbus ranks first with 24 incidents, while Zanesville ranked last, with Loading incidents.

PositionCity4Y Trend2023202220212020
1Columbus▼24332837
2Canton▼225918
3Cleveland↔21213726
4Toledo▲2017129
5Dayton▼18131619
6Cincinnati▲16112712
7Akron▲14323021
8Springfield▼10678
9Hamilton▲6311
10Mansfield▲6942

Ohio (OH) Fire Incidents with Fire Service Casualties (Top 10 Cities)

This table ranks Ohio (OH) cities based on the number of fires with firefighter casualties. Toledo ranks first with 20 incidents, while Zanesville ranked last, with Loading incidents.

PositionCity4Y Trend2023202220212020
1Toledo▼20132326
2Cleveland▲192105
3Columbus▼17273541
4Youngstown▲17151312
5Akron▲1222108
6Canton↔10399
7Cincinnati▲7354
8Mansfield▲6151
9Tiffin▲5000
10Euclid▲4333

Where is Fire Incident Data Coming From? NFIRS

The NFIRS is a reporting standard that fire departments use to uniformly report on the full range of their activities, from fire to emergency medical services (EMS) to equipment involved in the response.

Anyone analyzing the NFIRS data should note that NFIRS is neither a random sample nor a census of fire incidents or casualties in the United States. As such, the analyst may not accurately make estimates of total fires, fire losses, or fire casualties in the United States from NFIRS data alone. Similarly, statistical means (averages) or standard error measurements taken from NFIRS describe the population of fire incidents related to fire departments that participate in NFIRS but do not describe the population of fire incidents in the Nation as a whole. However, the proportion of fire incidents reported to NFIRS is large enough that reasonable inferences can be made that the proportions of fires in NFIRS are similar to the true national measurements.